AI Models
Improve localization workflow by using OpenAI, Google Gemini, and other providers.
Crowdin offers a range of additional services that can significantly improve your localization workflow while simplifying payment and service management. Bu hizmetler, birincil aboneliğinizden ayrı, adanmış bir bakiye kullanılarak doğrudan Crowdin hesabınız aracılığıyla yönetilir. Bu, YZ modellerine veya Crowdin Dil Hizmetleri gibi çeviri satıcılarına erişmek için ek hesaplar kaydetmenize gerek olmadığı anlamına gelir. By consolidating payments in one place, you gain greater control over your localization resources and expenses, ensuring seamless workflow integration.
Crowdin can manage the following paid services without the need to register separate accounts.
AI Models
Improve localization workflow by using OpenAI, Google Gemini, and other providers.
Çeviri Satıcıları
Crowdin Dil Hizmetleri ile profesyonel çeviri ve düzeltme okuması hizmetleri sipariş edin.
Crowdin Kredileri, ödemeleri Crowdin hesabınızdaki adanmış bir bakiye aracılığıyla ödemeleri işleyerek YZ modelleri ve çeviri satıcıları gibi ücretli araçların kullanımını basitleştirir. This centralizes balance management and provides a clear overview of your spending.
In the Crowdin Credits section, you can:
To start using Crowdin Credits, add funds to your account balance and activate the managed by Crowdin option for the services you want to use in your projects.
You can manage your Crowdin Credits balance by adding funds and setting up notifications about low balance.
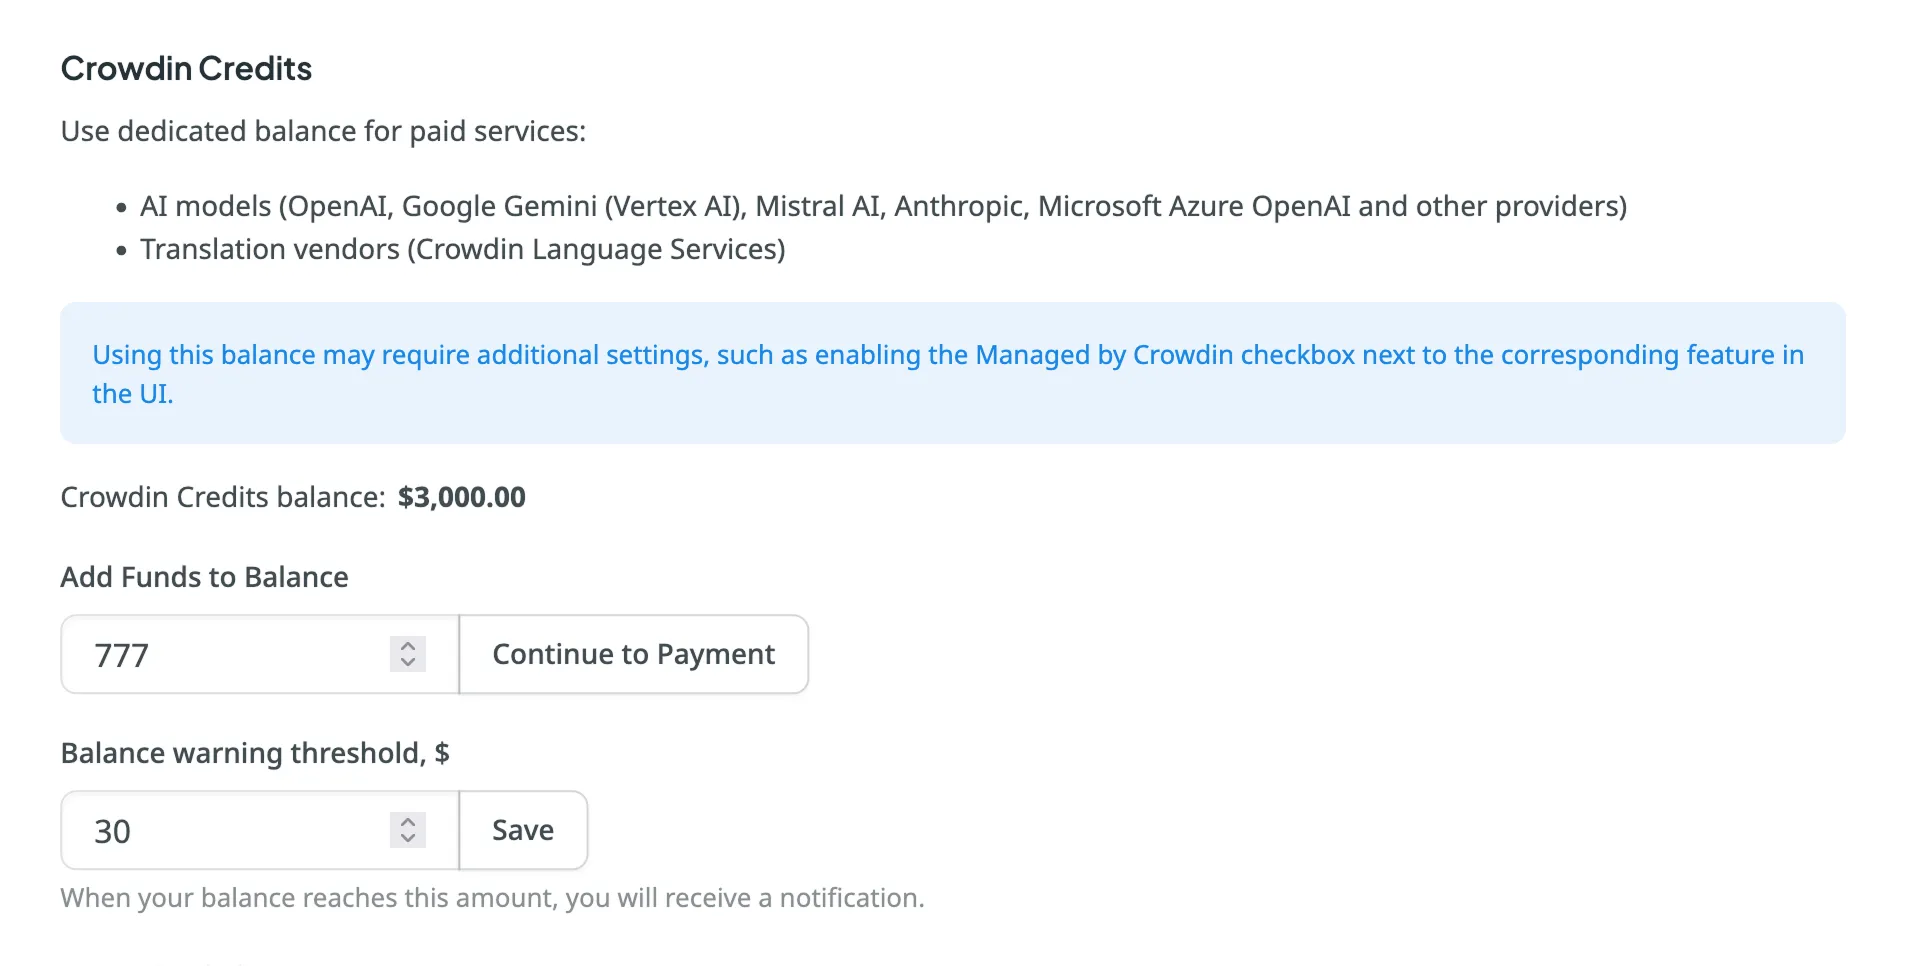
To add funds to your balance, follow these steps:
To ensure uninterrupted operation of paid services, you can set the preferred amount in the Balance warning threshold field so that when your balance reaches this point, you’ll automatically receive a notification.
To set up low-balance notifications, follow these steps:
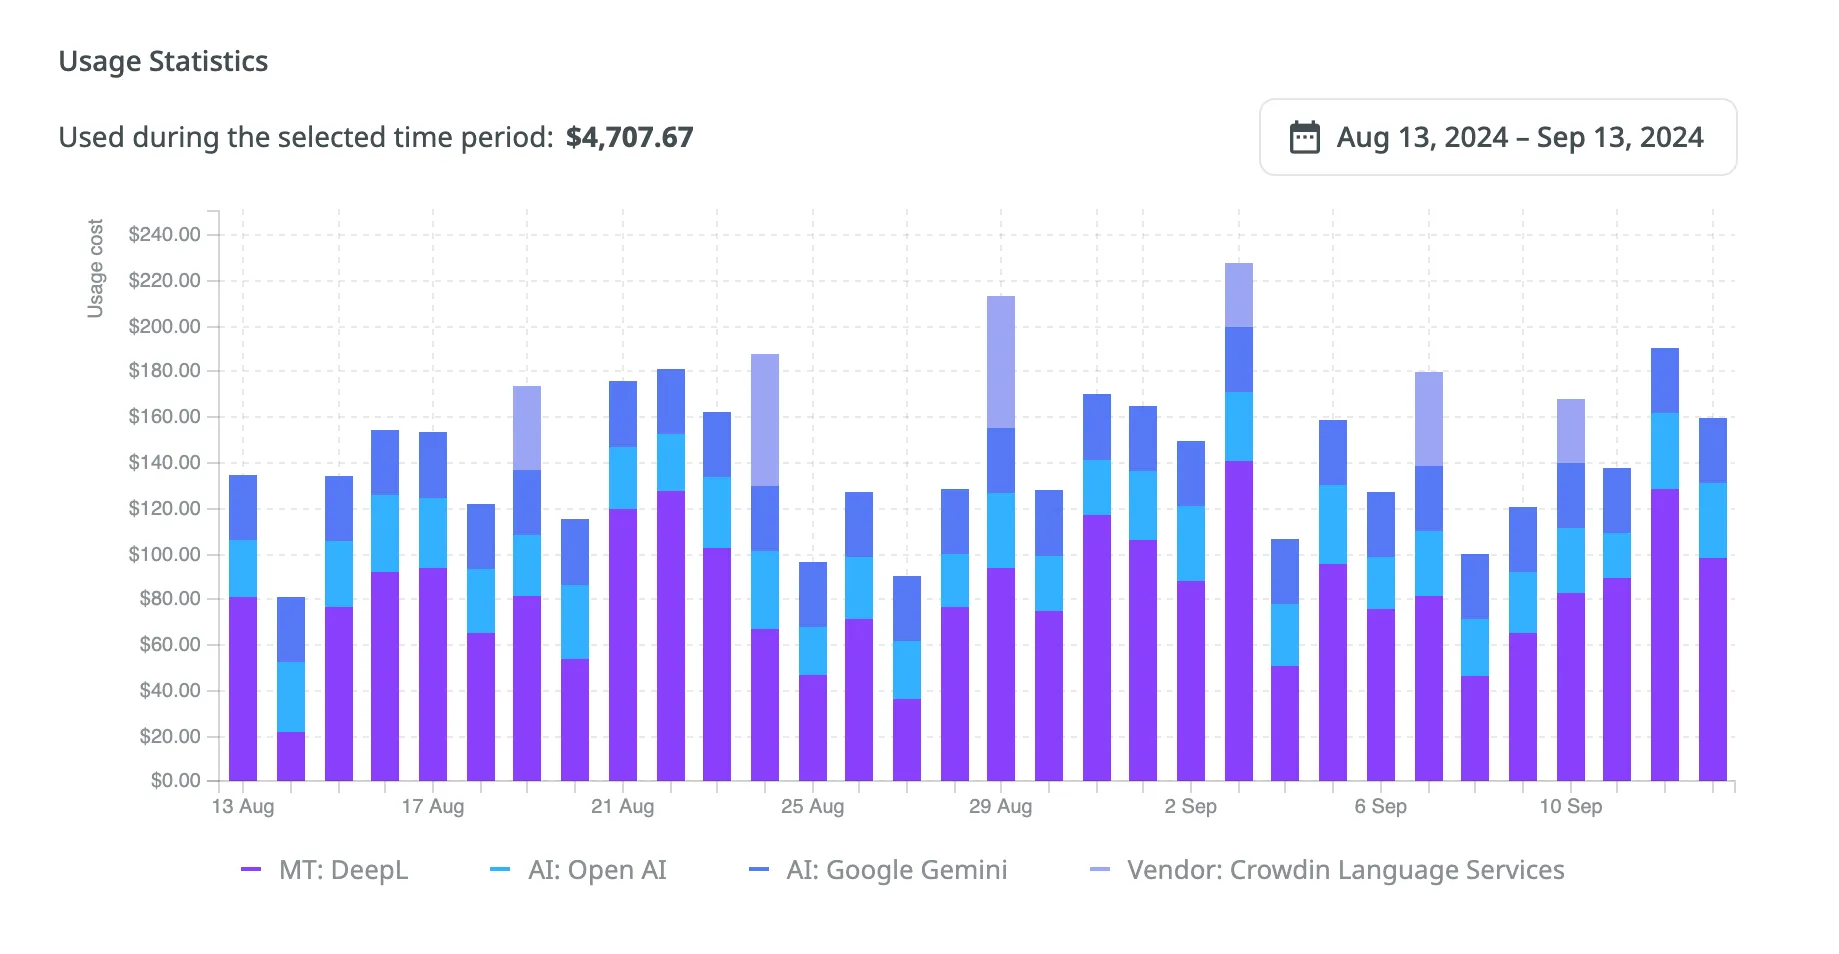
The Usage Statistics section provides a comprehensive visual analysis of your usage costs through an interactive graph, allowing you to review detailed statistics and track spending on each service based on your selected time period. In addition to the graph, the Used during the selected time period field shows the total amount spent during the chosen period.
The graph displays usage costs for each service from the available categories. Hover over any bar to see a breakdown of the expenses per service for that day, month, or year.
Depending on the selected date range, each stacked bar represents:
You can also focus on specific services by hovering over the service titles under the graph. To hide certain services from the graph, click on their names.